Start measurement
Basic measurement sequence
- Set the frequency range to be measured
- Perform calibration
- Connect the DUT
function
Trace display
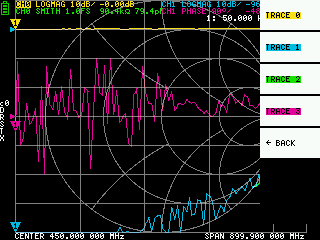
Up to four traces can be displayed, one of which is the active trace.
Traces can display only what is needed. To switch the display, select DISPLAY TRACE TRACE n .
The following methods can be used to switch the active trace.
- Tap the trace marker you want to activate
- Select
DISPLAYTRACETRACE nto display. (If already displayed, it must be temporarily hidden)
Trace format
Each trace can have its own format. To change the format of the active trace, select the format you want to change to DISPLAY FORMAT .
The display of each format is as follows.
LOGMAG: Logarithm of absolute value of measured valuePHASE: Phase in the range of -180 ° to + 180 °DELAY: DelaySMITH: Smith ChartSWR: Standing Wave RatioPOLAR: Polar coordinate formatLINEAR: Absolute value of the measured valueREAL: Real number of measured valueIMAG: Imaginary number of measured valueRESISTANCE: Resistance component of the measured impedanceREACTANCE: The reactance component of the measured impedance
Trace channel
NanoVNA has two ports, CH0 CH1 . The following S parameters can be measured at each port.
CH0S11 (reflection loss)CH1S21 (insertion loss)
To change the trace channel, select DISPLAY CHANNEL CH0 REFLECT or CH1 THROUGH .
marker
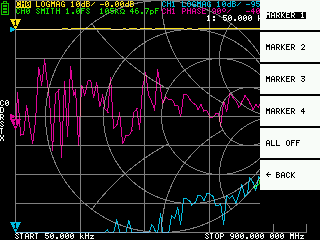
Up to 4 markers can be displayed. Markers are displayed from MARKER SELECT MARKER MARKER n . When you display a marker, the active marker is set to the displayed marker.
Time domain operation
NanoVNA can simulate time domain measurements by signal processing frequency domain data.
Select DISPLAY TRANSOFRM TRANSFORM ON to convert measurement data to the time domain. TRANSFORM ON is enabled, the measurement data is immediately converted to the time domain and displayed.
The relationship between the time domain and the frequency domain is as follows.
- Increasing the maximum frequency increases the time resolution
- The shorter the measurement frequency interval (ie, the lower the maximum frequency), the longer the maximum time length
For this reason, the maximum time length and time resolution are in a trade-off relationship.
In other words, the time length is the distance.
- If you want to increase the maximum measurement distance, you need to lower the maximum frequency.
- If you want to specify the distance accurately, you need to increase the maximum frequency.
Time domain bandpass
In bandpass mode, you can simulate the DUT response to an impulse signal.
The trace format can be set to LINEAR LOGMAG SWR .
The following is an example of the impulse response of a bandpass filter.
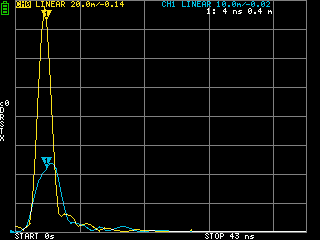
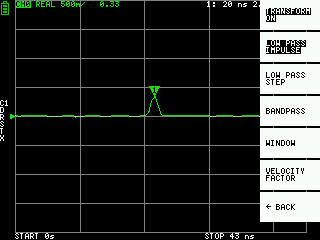
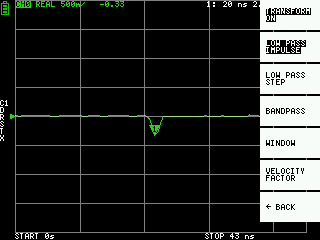
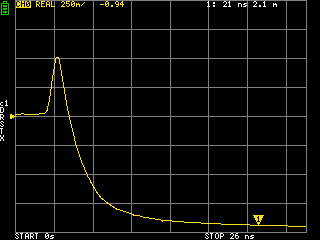
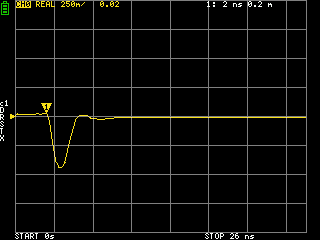
Time domain lowpass impulse
In low-pass mode, you can simulate TDR. In low-pass mode, the start frequency must be set to 50 kHz, and the stop frequency must be set according to the distance to be measured.
The trace format can be set to REAL .
Examples of step response in open state and impulse response in short state are shown below.
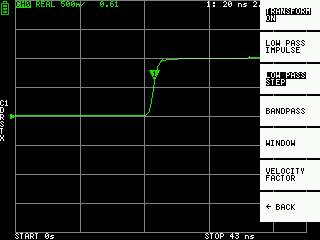
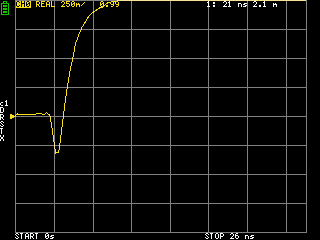
Time domain lowpass step
In low-pass mode, you can simulate TDR. In low-pass mode, the start frequency must be set to 50 kHz, and the stop frequency must be set according to the distance to be measured.
The trace format can be set to REAL .
open:
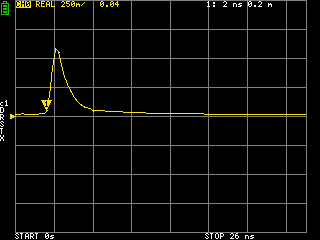
short:
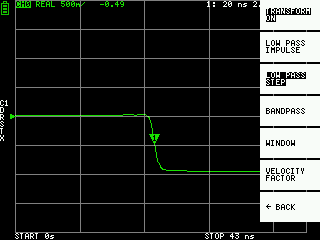
Step response example
Capacitive short:
Inductive short:
Capacitive discontinuity (C in parallel):
Inductive discontinuity (L in series):
Time domain window
The range that can be measured is a finite number, and there are minimum and maximum frequencies. A window can be used to smooth out this discontinuous measurement data and reduce ringing.
There are three levels of windows.
- MINIMUM (no window, ie same as rectangular window)
- NORMAL (equivalent to Kaiser window β = 6)
- MAXIMUM (equivalent to Kaiser window β = 13)
MINIMUM provides the highest resolution and MAXIMUM provides the highest dynamic range. NORMAL is in the middle.
Setting the wavelength factor in the time domain
The transmission speed of electromagnetic waves in the cable varies depending on the material. The ratio to the transmission speed of electromagnetic waves in vacuum is called the wavelength factor (Velocity Factor, Velocity of propagation). This is always stated in the cable specifications.
In the time domain, the displayed time can be converted into distance. The wavelength shortening ratio used for distance display can be set with DISPLAY TRANSFORM VELOCITY FACTOR . For example, if you measure the TDR of a cable with a wavelength reduction rate of 67%, specify 67 for the VELOCITY FACTOR .
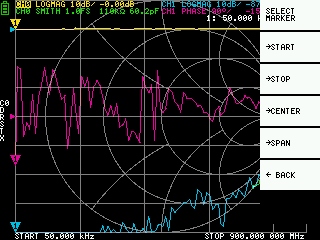
Set frequency from marker
You can set the frequency range from the marker as follows:
MARKER→STARTSets the active marker frequency to the start frequency.MARKER→STOPSets the active marker frequency to the stop frequency.MARKER→CENTERSets the frequency of the active marker to the center frequency. The span is adjusted to maintain the current range as much as possible.MARKER→SPANSets the two displayed markers including the active marker to the span. If only one marker is displayed, nothing happens.
Setting the measurement range
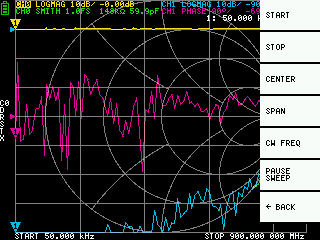
There are three types of measurement range settings.
- Setting the start frequency and stop frequency
- Setting the center frequency and span
- Zero span
Setting the start frequency and stop frequency
Select and set STIMULUS START and STIMULUS STOP , respectively.
Setting the center frequency and span
Select and set STIMULUS CENTER and STIMULUS SPAN respectively.
Zero span
Zero span is a mode in which one frequency is sent continuously without frequency sweep.
Select and set STIMULUS CW FREQ .
Temporarily stop measurement
STIMULUS PAUSE SWEEP is selected, measurement is temporarily stopped.
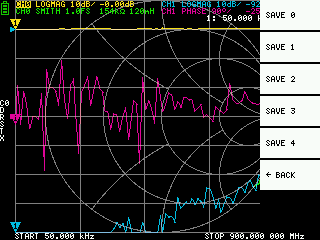
Recall calibration and settings

Up to 5 calibration data can be saved. NanoVNA loads number 0 data immediately after startup.
Calibration data is data that includes the following information:
- Frequency setting range
- Error correction at each measurement point
- Trace setting status
- Marker setting status
- Domain mode settings
- Setting the wavelength shortening rate
- electrical delay
You can save the current settings by selecting CAL SAVE SAVE n .
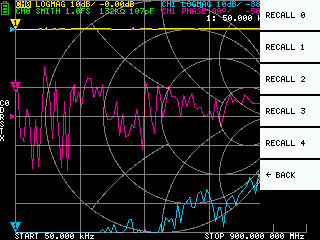
CAL current calibration data can be reset by selecting CAL RESET . If you want to recalibrate, you need to reset.
CAL CORRECTION indicates whether error correction is currently being performed. You can select this to temporarily stop error correction.
RECALL the saved settings by selecting RECALL RECALL n .
This page was translated from cho45’s NanoVNA User Guide.